Dashboard
The Dashboard in our RTB-Stack product serves as your central hub for key performance indicators and detailed analytics. It provides a comprehensive overview of your ad exchange's performance, offering insights into revenue, expenses, profit, views, and impression opportunities.
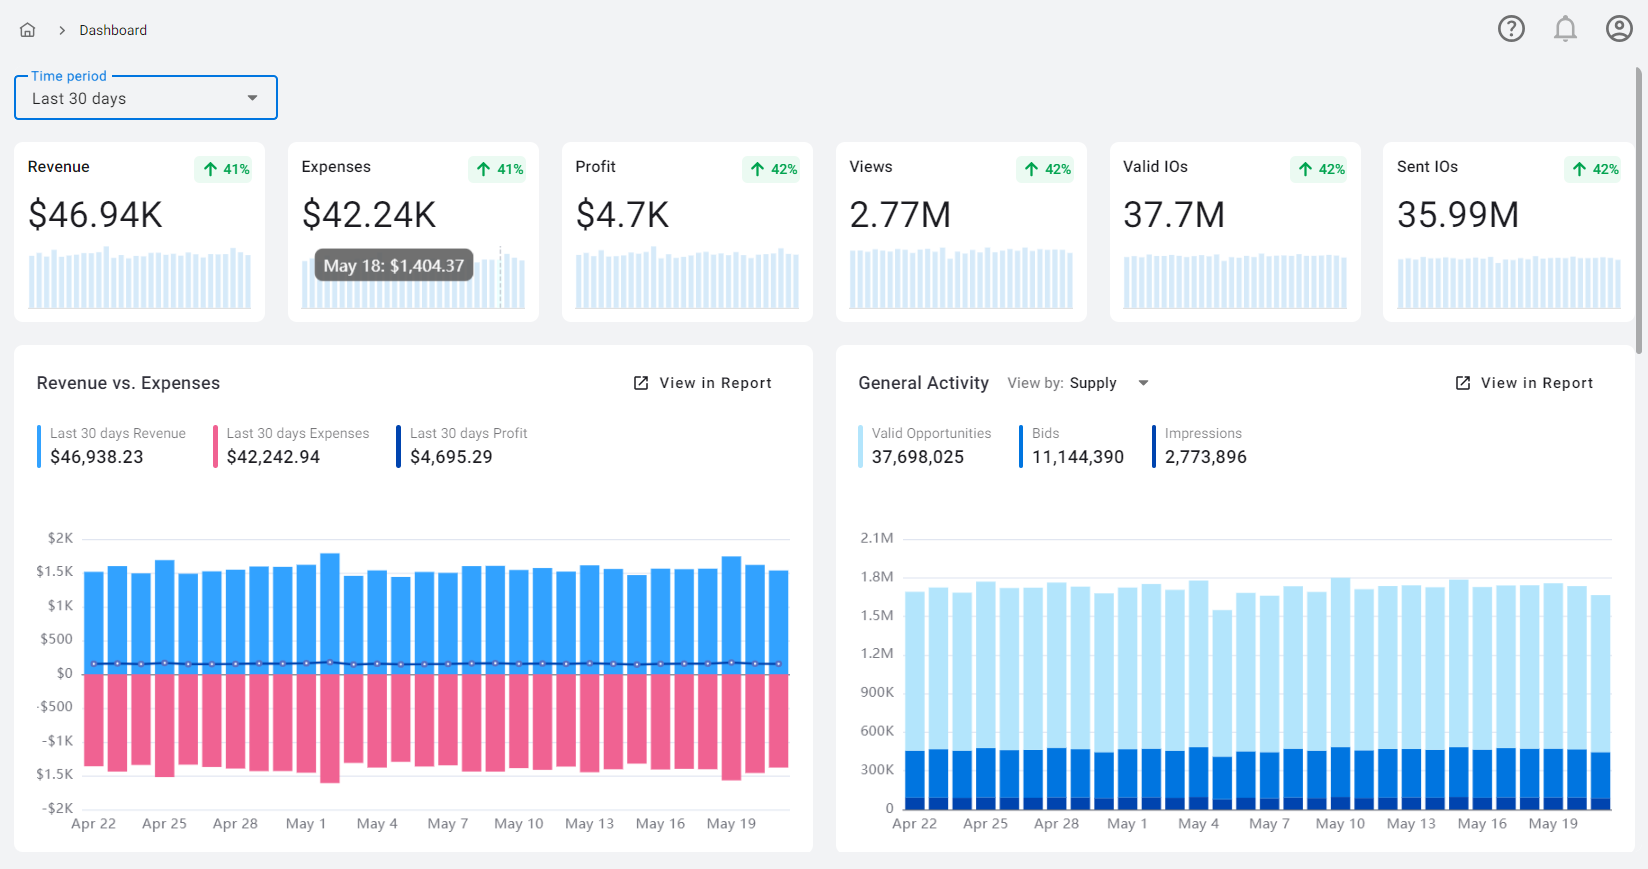
Time Period: The dropdown menu allows you to select a specific time period for your data. Options include today, yesterday, the last 7 days (including today), the last 30 days (including today), last month, and this month. The data on the graph is split by hour for 'today' and 'yesterday', and by day for the other options.
Key Performance Indicators: The Dashboard displays six small graphs at the top, each representing a key performance indicator: Revenue, Expenses, Profit, Views, Valid Impression Opportunities (Total Impression Opportunities - Filtered Impression Opportunities), and Sent Impression Opportunities. Each graph includes a dynamic comparison to the previous period. Hover over each bar on a chart to see the date and data for that date.
Revenue vs Expenses: This graph offers a visual representation of your revenue and expenses over the selected period. By hovering over each chart, you can view a detailed daily breakdown of Revenue, Expenses, and Profit.
General Activity: This graph, which can be toggled between Supply and Demand views via a dropdown menu, provides a snapshot of your ad exchange's activity. In the Supply view, the graph displays data on Valid Opportunities, Bids, and Impressions for the selected period. In the Demand view, it presents data on Sent Opportunities, Valid Bids (Total Bids - Filtered Bids), and Impressions for the period.
Tables: The Dashboard includes six tables for a more detailed analysis:
- SSP Performance: This table provides a comprehensive view of each SSP's performance. It lists all SSPs and displays corresponding data for Valid Opportunities, Bids, Impressions, Expenses, and Profit.
- DSP Performance: This table offers a detailed overview of each DSP's performance. It lists all DSPs and presents associated data for Sent Opportunities, Valid Bids, Impressions, Revenue, and Profit.
- TOP 100 Advertisers (by Profit): This table ranks the top 100 advertisers based on profit. It lists each advertiser and provides corresponding data for Valid Bids, Impressions, and Profit.
- TOP Countries: This table provides a geographical breakdown of performance. It lists countries and displays corresponding data for Valid Opportunities, Impressions, and Profit.
- Filtered Opportunities: This table can be customized to display data either by reason or by SSP, based on your selection from the dropdown menu. When viewed by reason, the table presents a list of reasons along with the corresponding number of Filtered Opportunities for each. When viewed by SSP, the table provides a list of SSPs, the number of Valid Opportunities, the number of Filtered Opportunities, and the percentage of Filtered Opportunities out of the Total Opportunities for each SSP.
- Rejected Bids: This table can also be adjusted to display data either by reason or by DSP, according to your selection from the dropdown menu. When viewed by reason, the table shows a list of reasons and the corresponding number of Rejected Bids for each. When viewed by DSP, the table displays a list of DSPs, the number of Valid Bids, the number of Rejected Bids, and the percentage of Rejected Bids out of the Total Bids for each DSP.
Each graph and table includes a 'View in Report' button in the upper right corner, leading to the Report Builder with the generated report. Here, you can edit it, save it as a template, or download it. For more information on reports, please refer to this guide.
The Dashboard is designed to provide you with a comprehensive, at-a-glance view of your ad exchange's performance, helping you make data-driven decisions to optimize your strategies.